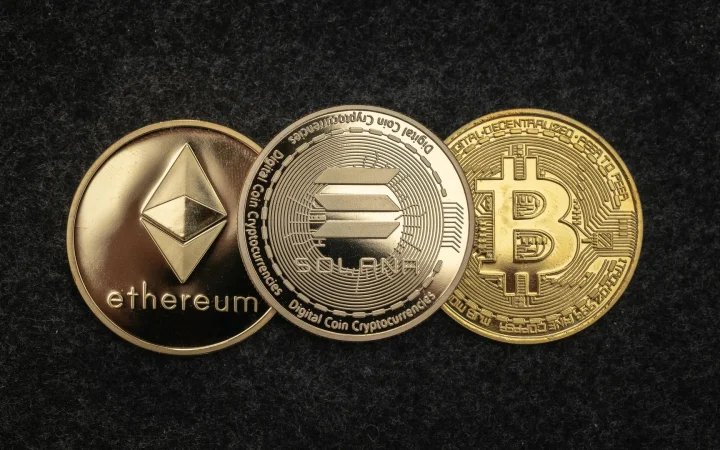










The intraday range stretched from roughly $63,800 to $66,000, showing that buyers returned after the sharp sell-off without fully restoring the previous price structure. The bounce reduced immediate liquidation pressure, yet the market remains below the levels that held before the latest decline.

ETF demand has not stabilised
The twelve US spot Bitcoin funds recorded about $1.91 billion in net outflows across seven consecutive trading sessions through November 13. During the five sessions from November 9 to 13, the daily figures were approximately $201 million, $95 million, $299.8 million, $284.1 million and $185.4 million of net withdrawals.
Those flows do not determine Bitcoin’s price on their own, but they remove a source of steady spot demand. When ETF redemptions coincide with leveraged liquidations, each decline can become sharper because forced selling meets fewer patient buyers.
A rebound is not yet a trend change
The move back above $64,000 shows that the market can absorb some selling, especially after open interest and speculative positions were reduced. Confirmation would require more than one positive session. Traders will watch whether ETF flows improve, whether spot volume remains healthy and whether Bitcoin can hold gains without another wave of leverage.
Volatility also increased. That matters because wider daily ranges raise the cost of short-term positioning and make aggressive stop levels easier to reach. Investors who entered during the rebound still face a market capable of moving several thousand dollars within one session.
- Bitcoin traded near $64,600 on November 16.
- The daily range was approximately $63,800 to $66,000.
- US spot Bitcoin ETFs lost about $1.91 billion over seven consecutive sessions.
- The rebound followed a weekend low close to $62,000.
The current picture is therefore mixed. Bitcoin has moved away from the lowest point of the sell-off, but institutional flows have not yet provided a clear foundation for a sustained recovery. The next ETF sessions and the market’s response around the mid-$60,000 area should reveal whether the bounce is accumulation or only a pause.
This article is for information only and is not investment advice.
 admin_wcContributor · World-CryptMore from